A Comprehensive Analysis of AI-Powered Analytics Products: Comparing the Capabilities of ThoughtSpot, Qlik, PowerBI, Tableau and DataGPT
Discover how DataGPT revolutionizes AI-powered analytics with unparalleled conversational understanding and insightful analysis, surpassing traditional tools like PowerBI in user question comprehension and depth of insights.
In the quickly evolving realm of AI-enhanced data analytics, it can be challenging to compare and understand the capabilities available in the market today. This article examines the performance of AI-powered analytics platforms across various parameters, from question comprehension to the depth of insights they provide.
Question Comprehension and Discernment
An integral focus is on how well these tools comprehend user questions. Users should be able to ask about their data naturally, without specifying dimensions, metric calculations, or time ranges, yet still receive insightful answers. This includes their proficiency in handling synonyms, typos, and temporal nuances like "this month" or "last week." We also investigate their ability to respond to fundamental data questions and accommodate filtering conditions, such as geographical and time constraints.
Depth of Insight
Moving beyond surface-level capabilities, our analysis extends to the depth of insight offered by each tool. We explore their competence in identifying key drivers, outliers, trends, and forecasting capabilities.
Guided/Unprompted Insights
We also explore a critical aspect of these products, providing insights, guided or unprompted. We evaluate how effectively users can obtain valuable information without specific prompts, offering a measure of the tools' proactive analytical strengths.
ThoughtSpot: Early Innovator With Limitations
ThoughtSpot was an early innovator in the realm of leveraging natural language for data analysis. It has a powerful environment for connecting to data and making it available to end users. However, its natural language capabilities are not very good at comprehension, often yielding a single chart in response to complex queries. Ultimately, ThoughtSpot functions primarily as a chart generator, where users input pseudocode to select fields and create single charts. This somewhat simplistic approach can leave users iterating through several cycles to fully understand their business questions.
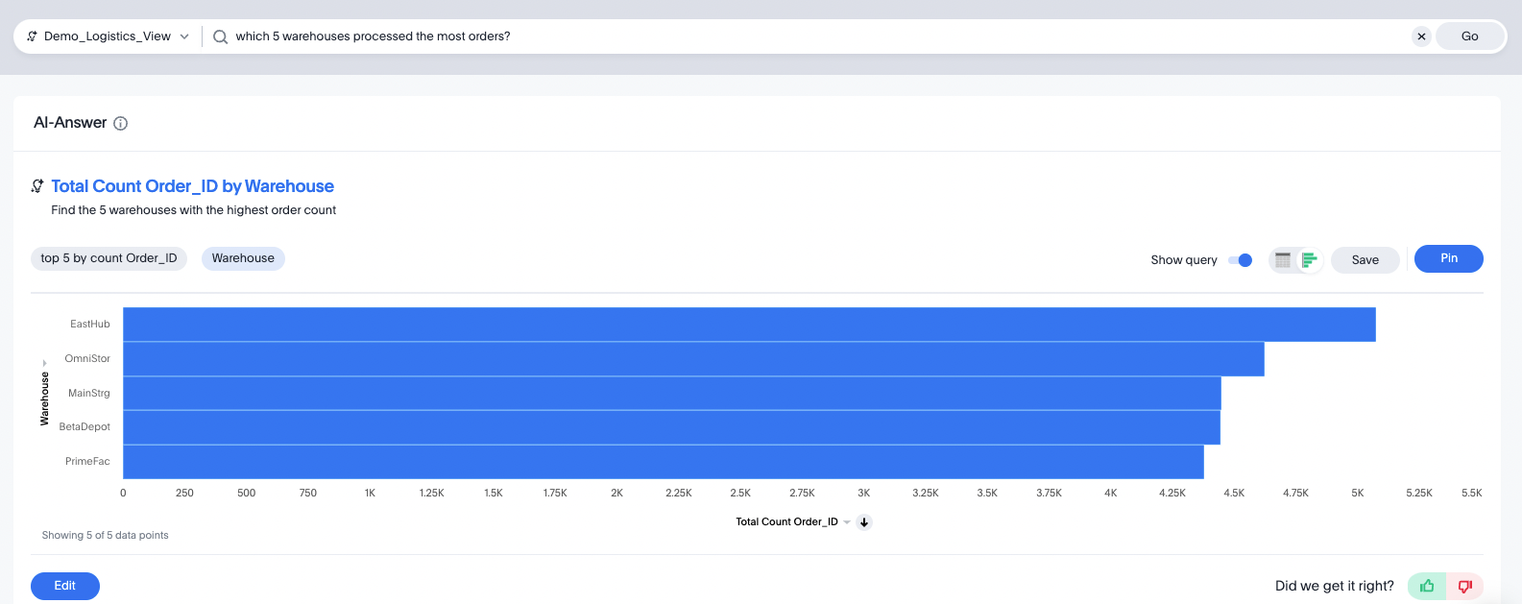
In terms of question comprehension, ThoughtSpot impressively recognizes available dimensions even in the presence of deviations like plurals and typos. However, its weakness lies in its inability to discern the appropriate dimension when the context is ambiguous. For instance, asking about the performance of "Omnistor" without specifying it is in the "Warehouse" dimension led Thoughtspot to assume it was a customer. Furthermore, inquiries about dates tend to result in inaccurate filters on the date field. To be fair, some of these dimension recognitions are expected to improve as more users engage with a given ThoughtSpot Worksheet.
Delving into the depth of the provided insights, ThoughtSpot typically offers a single suggested chart for each question posed. Notably, the use of keywords like "best," "most," or "worst" may trigger a "limit 1" filter, focusing the scope of the generated insights. This level of insight seems like a modest productivity improvement for generating a single “top N” query.
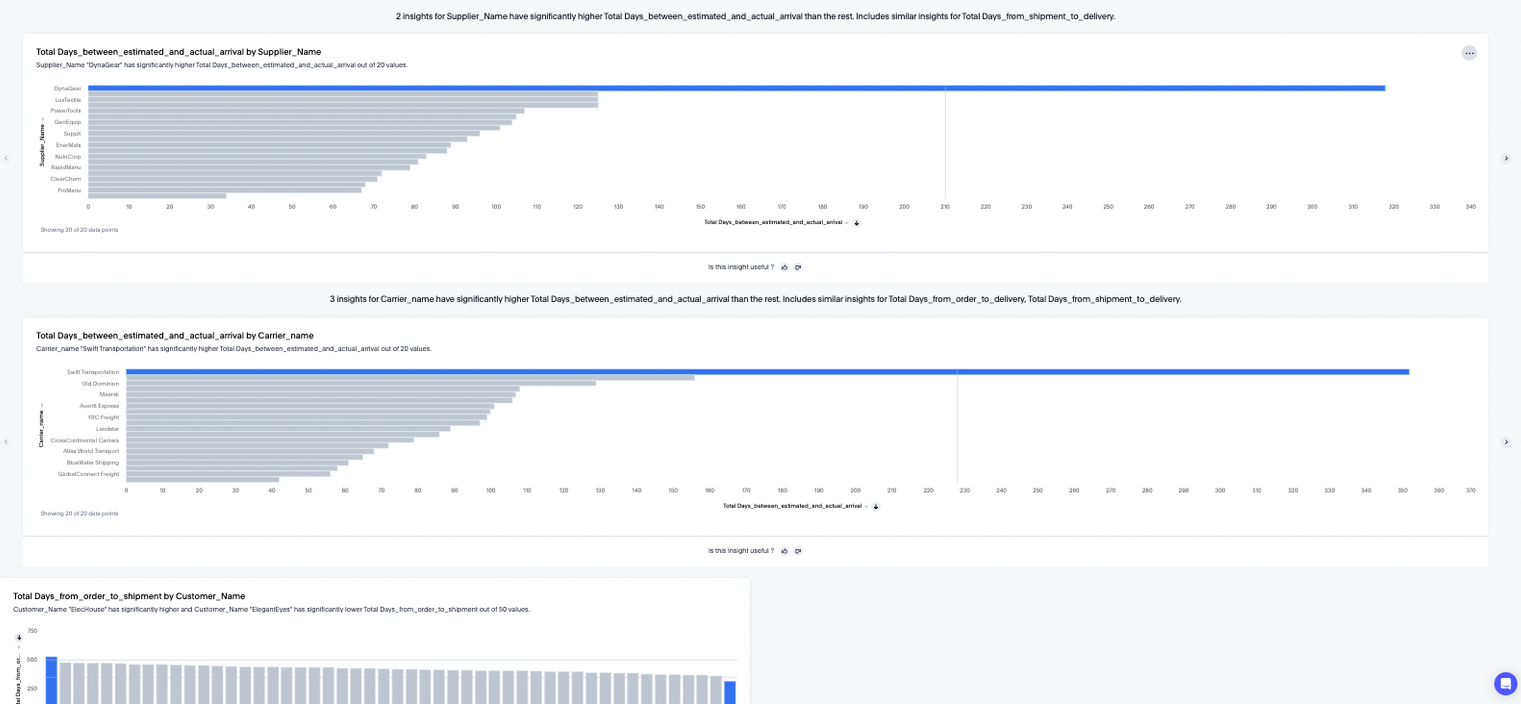
ThoughtSpot's SpotIQ feature allows users to configure and schedule the generation of insights on specific datasets. This feature generates many charts using the user-specified dimensions and highlights significantly higher or lower values compared to the whole population. SpotIQ can also highlight two dimensions with high correlation. However, during our testing, we selected many dimensions for analysis to see which insights it would highlight. This resulted in dozens of charts, and it quickly became unwieldy to review all the generated output or to discern what was important.
PowerBI (Co-Pilot): Versatile Yet Complex BI Giant
PowerBI is a very popular BI product in the data analysis world and has incorporated new AI features such as Q&A. It offers extensive control and customization for data handling, but this comes with a significant learning curve due to the complexity of its interface, which includes PowerQuery, DAX, and relationship management interfaces. The AI functionalities, while present, feel basic and are not well-integrated with the tool’s other analytical capabilities.
When it came to understanding questions, the tool was very limited. It often got confused between different ways of adding up numbers and struggled with typos and synonyms. Trend analysis, segmenting questions, and understanding time-based criteria also proved to be tricky for the tool. This was surprising since Power BI has had rich date filtering, trends, and other advanced features in its development environment for a while. It seems it hasn't yet integrated it with the chat interactions. The natural language interactions were more like a search for available fields and for applying only strict filters.
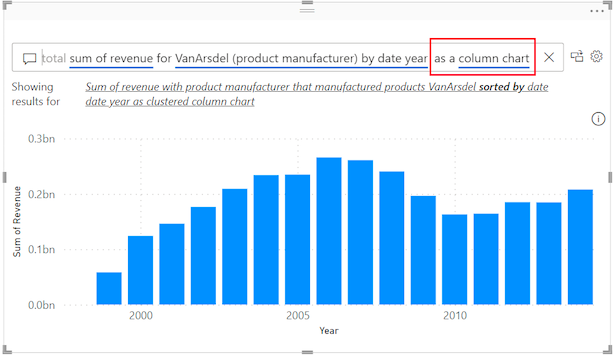
Looking at the insights it offered, the tool was good at creating a single chart or KPI box on a new page. However, it lacks natural language observations or interpretations. Users have the flexibility to modify measures and filters, but this does not translate into a more intuitive, user-friendly analytical process.
In terms of guided and unprompted insights, PowerBI's Quick Insights feature offers users the ability to analyze specific dimensions and measures, producing outputs like summary KPIs, various charts, and outlier detection. However, this functionality is limited to smaller data segments, as it only effectively processes subsets of up to 1,000 rows. This limitation highlights potential performance issues when dealing with larger datasets. In a nutshell, while the tool gave users good control and customization options, it faced challenges in understanding certain types of questions and dealing with larger datasets.
Qlik: Robust Analytics with Interface Challenges
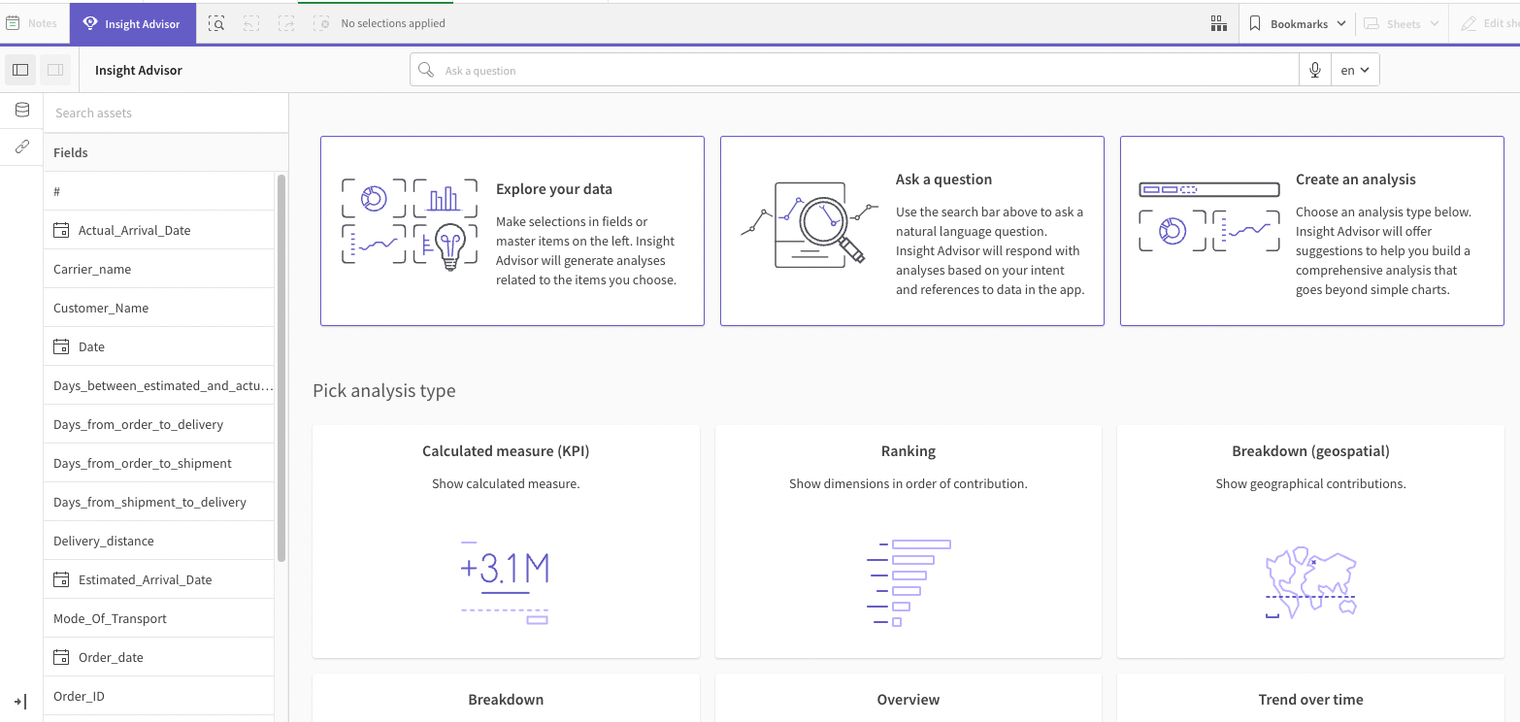
Qlik leverages its data catalog and ETL products to create a cohesive experience for connecting and analyzing data. Their Insights Advisor can be accessed from multiple areas of their BI product to ask natural language questions or select fields to generate automatic insights. However, its chat capabilities struggle to recognize fields unless exact terms are used, rather just selects a few charts that maybe helpful for the user’s desired analysis. Most of the powerful analytics capabilities in Qlik still need to be accessed via drag and drop, and sifting through the proposed charts generated by the Insights Advisor. Ultimately the AI features seem to be geared towards accelerating dashboard development for skilled visualization developers.
In Qlik Sense, adding derived fields and custom calculations is straightforward, though it requires a good grasp of analytics and Qlik's set analysis. A notable limitation in Qlik's query handling is its strict requirement for exact dimension names. For instance, using a plural term like 'Warehouses' instead of 'Warehouse' can lead to no results from the Insights Advisor. At the same time, it efficiently manages broader queries, such as analyzing sales in countries like Japan and Germany, without needing explicit dimension specifications.
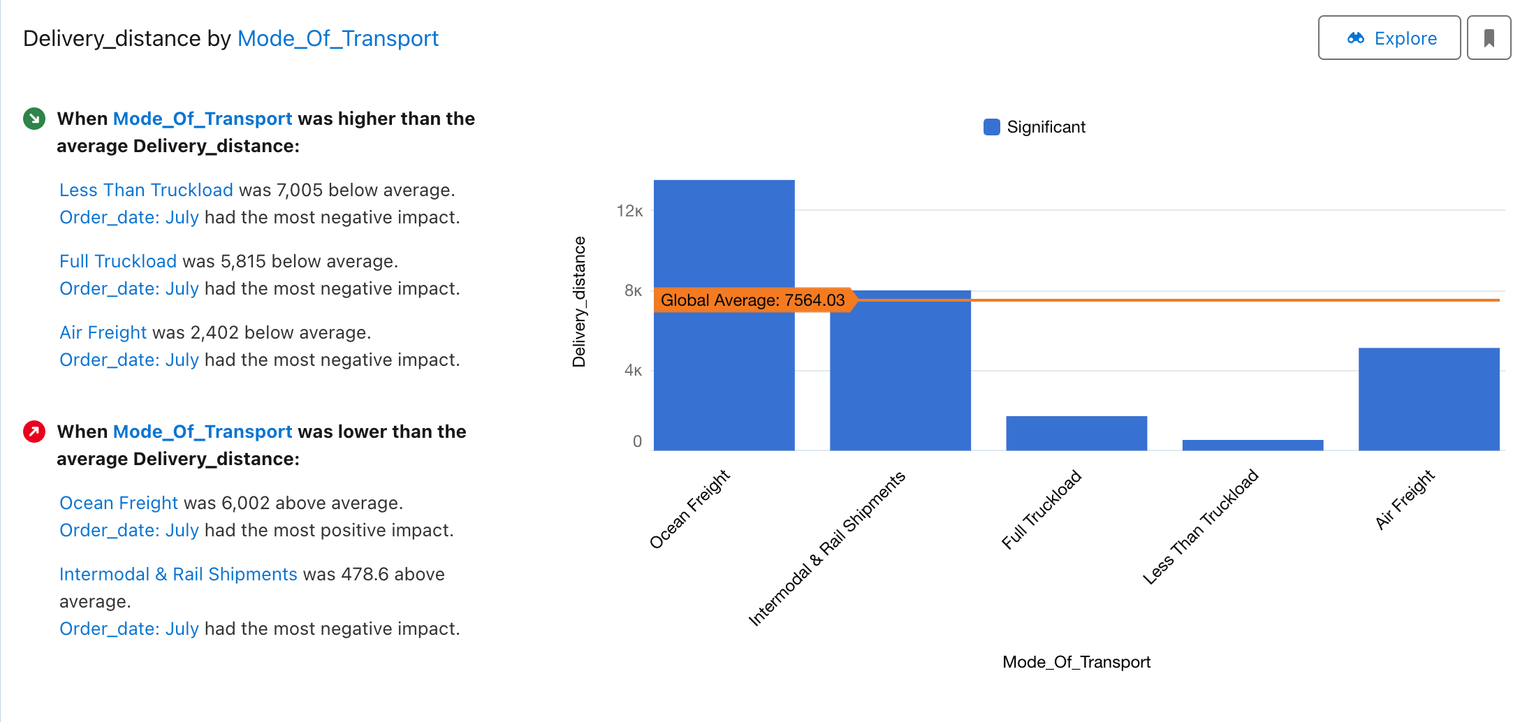
In terms of insight depth, Qlik's response to queries typically includes one main chart and several additional ones. It also provides natural language bullet points for straightforward insights related to these charts. The Insights Advisor also offers a menu with a variety of analytical types, like Correlation Analysis and Trend Over Time, accessible through a user-friendly drag-and-drop interface. However, we were unable to use natural language prompts to get to these functionalities.
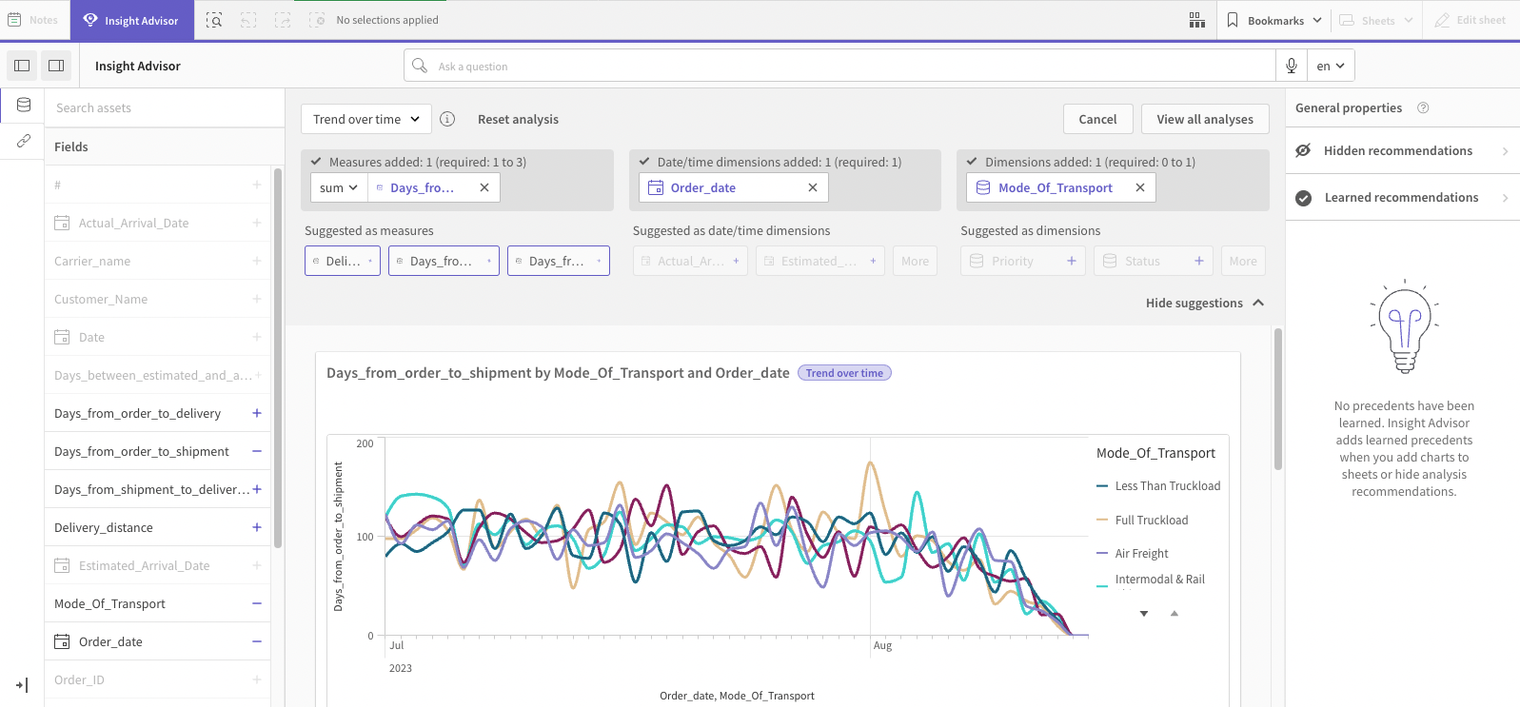
Qlik's auto-analysis feature, similar to ThoughtSpot's SpotIQ, presents an interface where users can choose fields of interest and generate numerous charts based on those selections. This functionality is particularly useful for examining specific relationships within data. However, when multiple fields are chosen, the volume of generated charts can be overwhelming, making it challenging to efficiently navigate through all the available options and pinpoint key visual insights.
Tableau: Advanced Visualization with Einstein AI, But Requires Expertise
Tableau, renowned for its superior visualization capabilities, ventured into AI-enhanced analytics with features like "Ask Data" and Einstein AI. "Ask Data" offers natural language query capability, yet it struggles with complex queries and lacks depth in answering 'why' questions, leading to its expected discontinuation.
Einstein AI, integrated post-Salesforce acquisition, promises insightful data extraction but faces challenges; It heavily depends on data quality and demands considerable machine learning expertise from users. For example, one key issue is the inappropriate use of t-tests for non-normally distributed data, increasing the risk of false positives. It also requires new model training for each metric, adding complexity.
The AI's reliance on t-tests for numerical analysis is problematic, as these tests assume a normal data distribution, which isn't always the case in real-world datasets. This fundamental flaw can mislead users with incorrect statistical conclusions. Additionally, the high volume of statistical tests conducted by Einstein AI exacerbates the multiple comparisons problem, potentially leading to significant results by chance.
Tableau's Einstein AI requires user input for guided insights and is limited in offering unprompted insights. Its effectiveness depends on the user's ability to accurately select metrics for analysis. Unlike competitors, it doesn't intuitively reveal hidden trends and overwlhelms users with an excessive number of insights, demanding considerable time for evaluation.
In summary, while Tableau excels in visual representation and offers detailed analysis, it requires significant data science knowledge for full benefit, particularly with its Einstein AI feature closely tied to the Salesforce platform.
DataGPT: Next-Gen Analyst with Conversational Depth
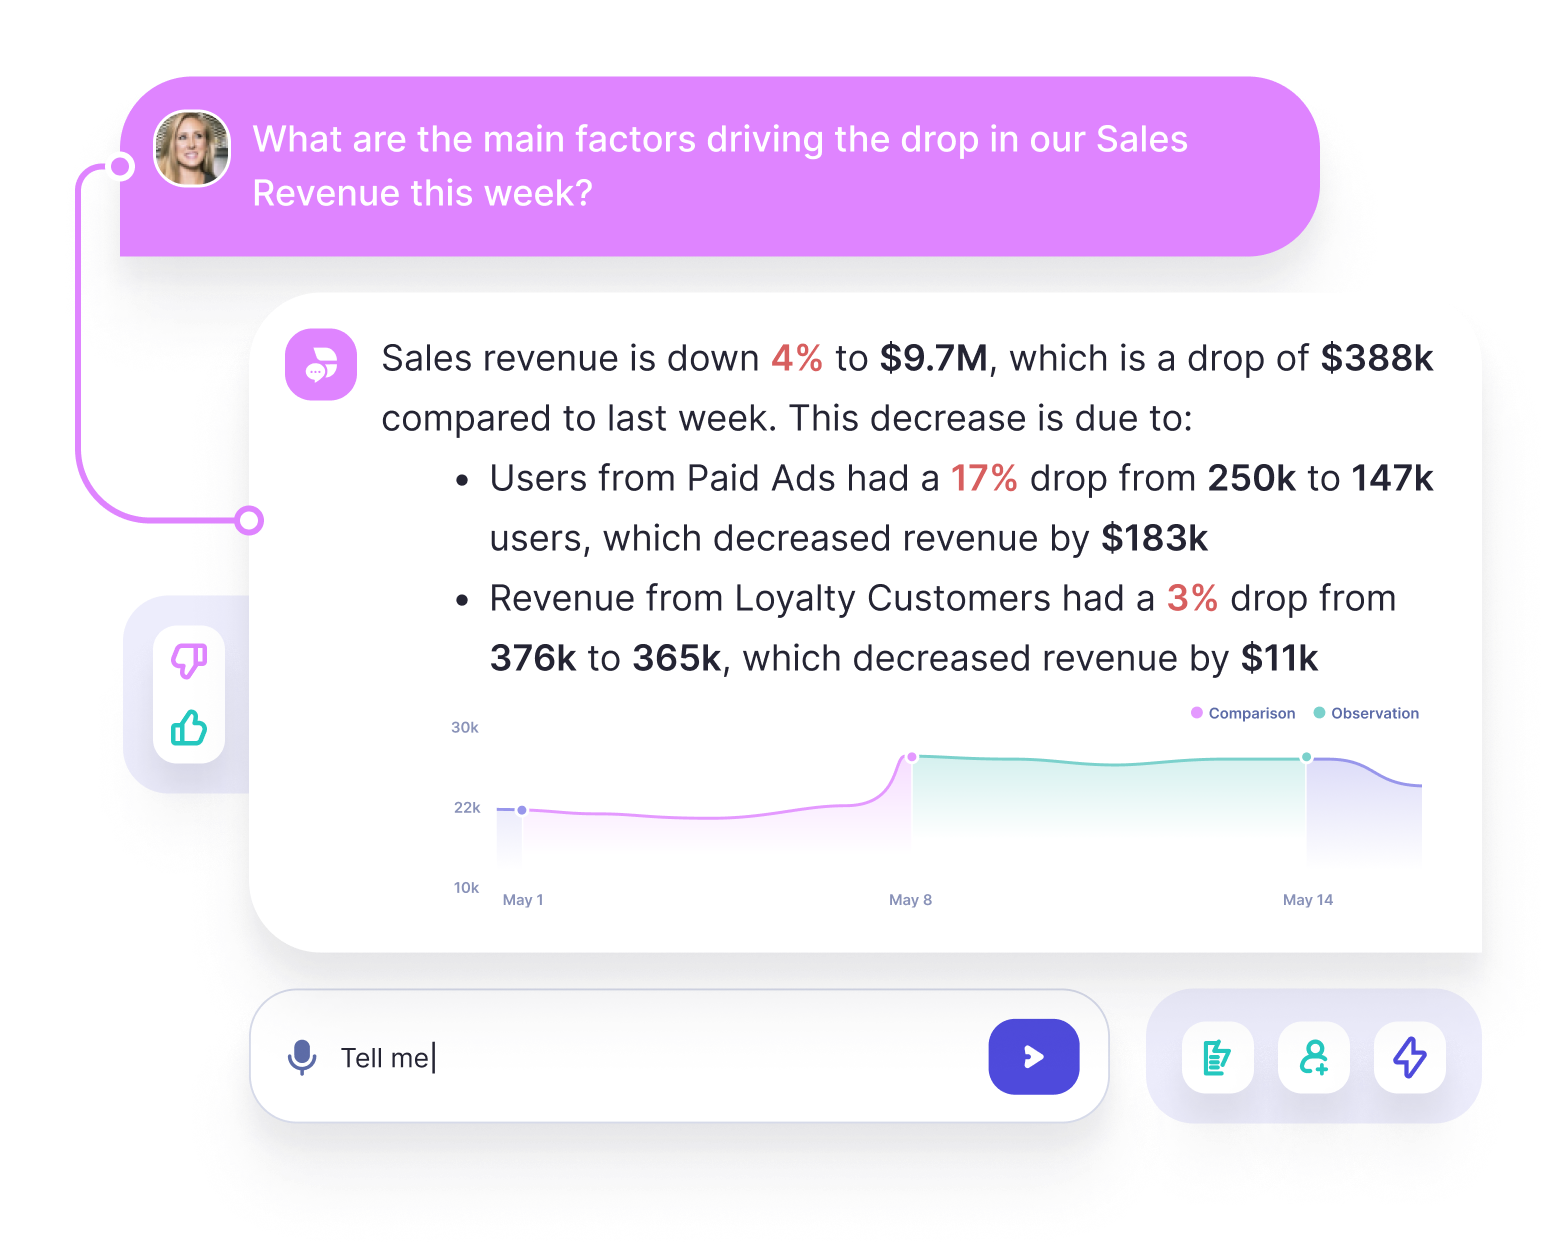
DataGPT marks a significant evolution in the analytics field, aiming to function as a comprehensive data analyst rather than just a visual analytics tool. It has the strongest chat feature, excelling at providing conversational and in-depth analysis. It also stands out for its ability to understand and connect vague or synonymous terms with relevant data. All the while ensuring accuracy is not impacted where users can easily verify the data and investigate further with the generated visualizations. Additionally, DataGPT offers clear natural language explanations, making complex analytical concepts like p-values comprehensible for business users and technical alike.
Data transformations can be configured within the app, including type casting, parsing, or grouping data into buckets. Users can easily customize metrics on the schema page, setting business-friendly names, units, and detailed drill-down options.
DataGPT reliably understood questions and provided relevant responses. When testing with synonyms, typos, and vague references to values, the most relevant dimensions and metrics were identified. When asking for various time periods such as "the last 2 weeks of November" or "last week", the appropriate filters were used and helpful metrics were calculated accurately.
DataGPT automatically provides a summary, detailed analysis, and visualizations in response to queries, adeptly incorporating trends and specific data segments. It highlights key values and changes, guiding users in strategic decision-making.
DataGPT particularly excels in unprompted insights. Upon landing in the databoard, users see a summary of key movements in the metrics and recommendations for further analysis. Without specifying any dimensions or metrics, the application automatically highlights significant movements in the data and emerging trends. Rather than just natural language queries, DataGPT is a proactive data analyst that enables data-driven discourse and flexible analysis.
Stephanie Wong is the director of Data & Technology Consulting at DataGPT: A Place to ask questions.
Book a demo to explore how DataGPT can enhance your business operations.